How to plot a large CSV file with millions of rows
By MegaRows · Published · Updated · 10 min read
A data logger, a test rig or a busy web server can write millions of rows in an afternoon. Then you try to chart them: Excel stops at 1,048,576 rows, a Python plot takes a minute to appear, and an online plotter may stop at a size limit. This guide explains why big files are hard to plot, why some charts hide the very spikes you are looking for, and which options work today.
Plot a large CSV in 60 seconds
Free, nothing to install and no account. The file is read on your device and never uploaded, and millions of rows are fine: a 10-million-row CSV opens and draws its first chart in about 3 seconds.
Measured in Chrome on a recent laptop (Apple M4): a 423 MB CSV with 10,000,000 rows and 5 columns, from choosing the file to the first chart. Slower devices take longer.
Open the plotter and drop your CSV
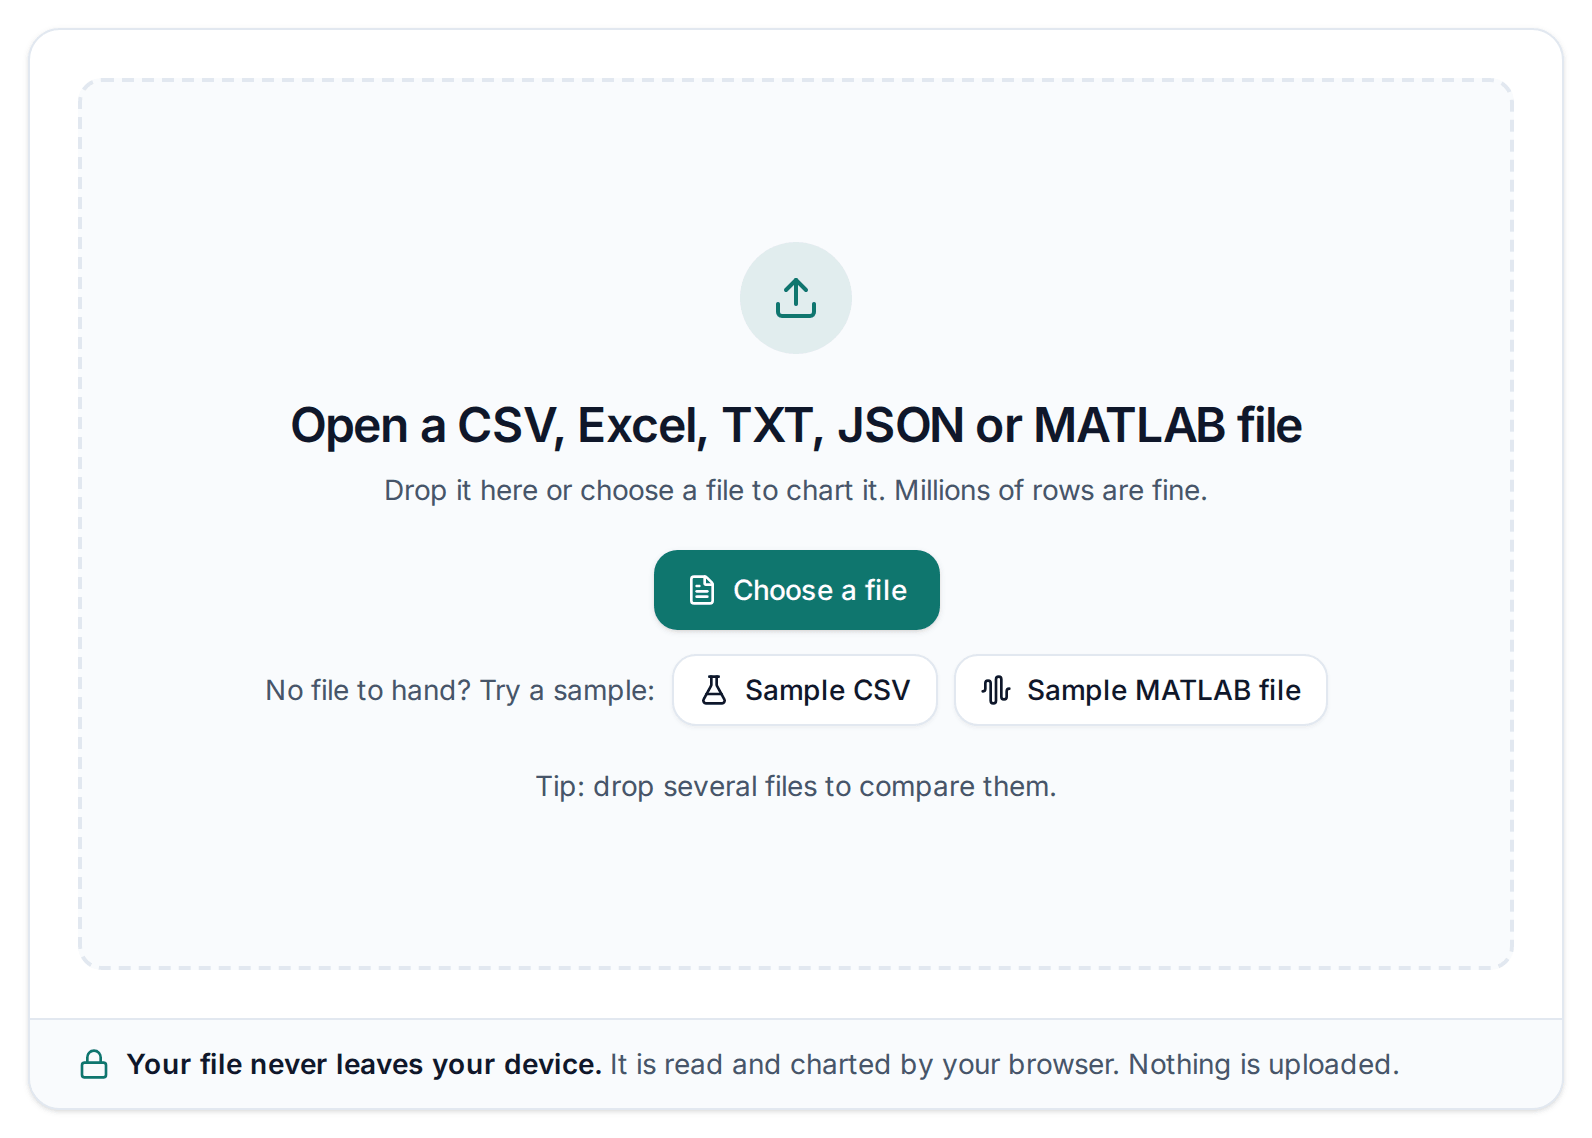
Drag the file onto the plotter, or click “Choose a file”. No file to hand? Click “Sample CSV”. Separators, decimal commas, dates and header lines are detected for you.
Pick the X column and channels
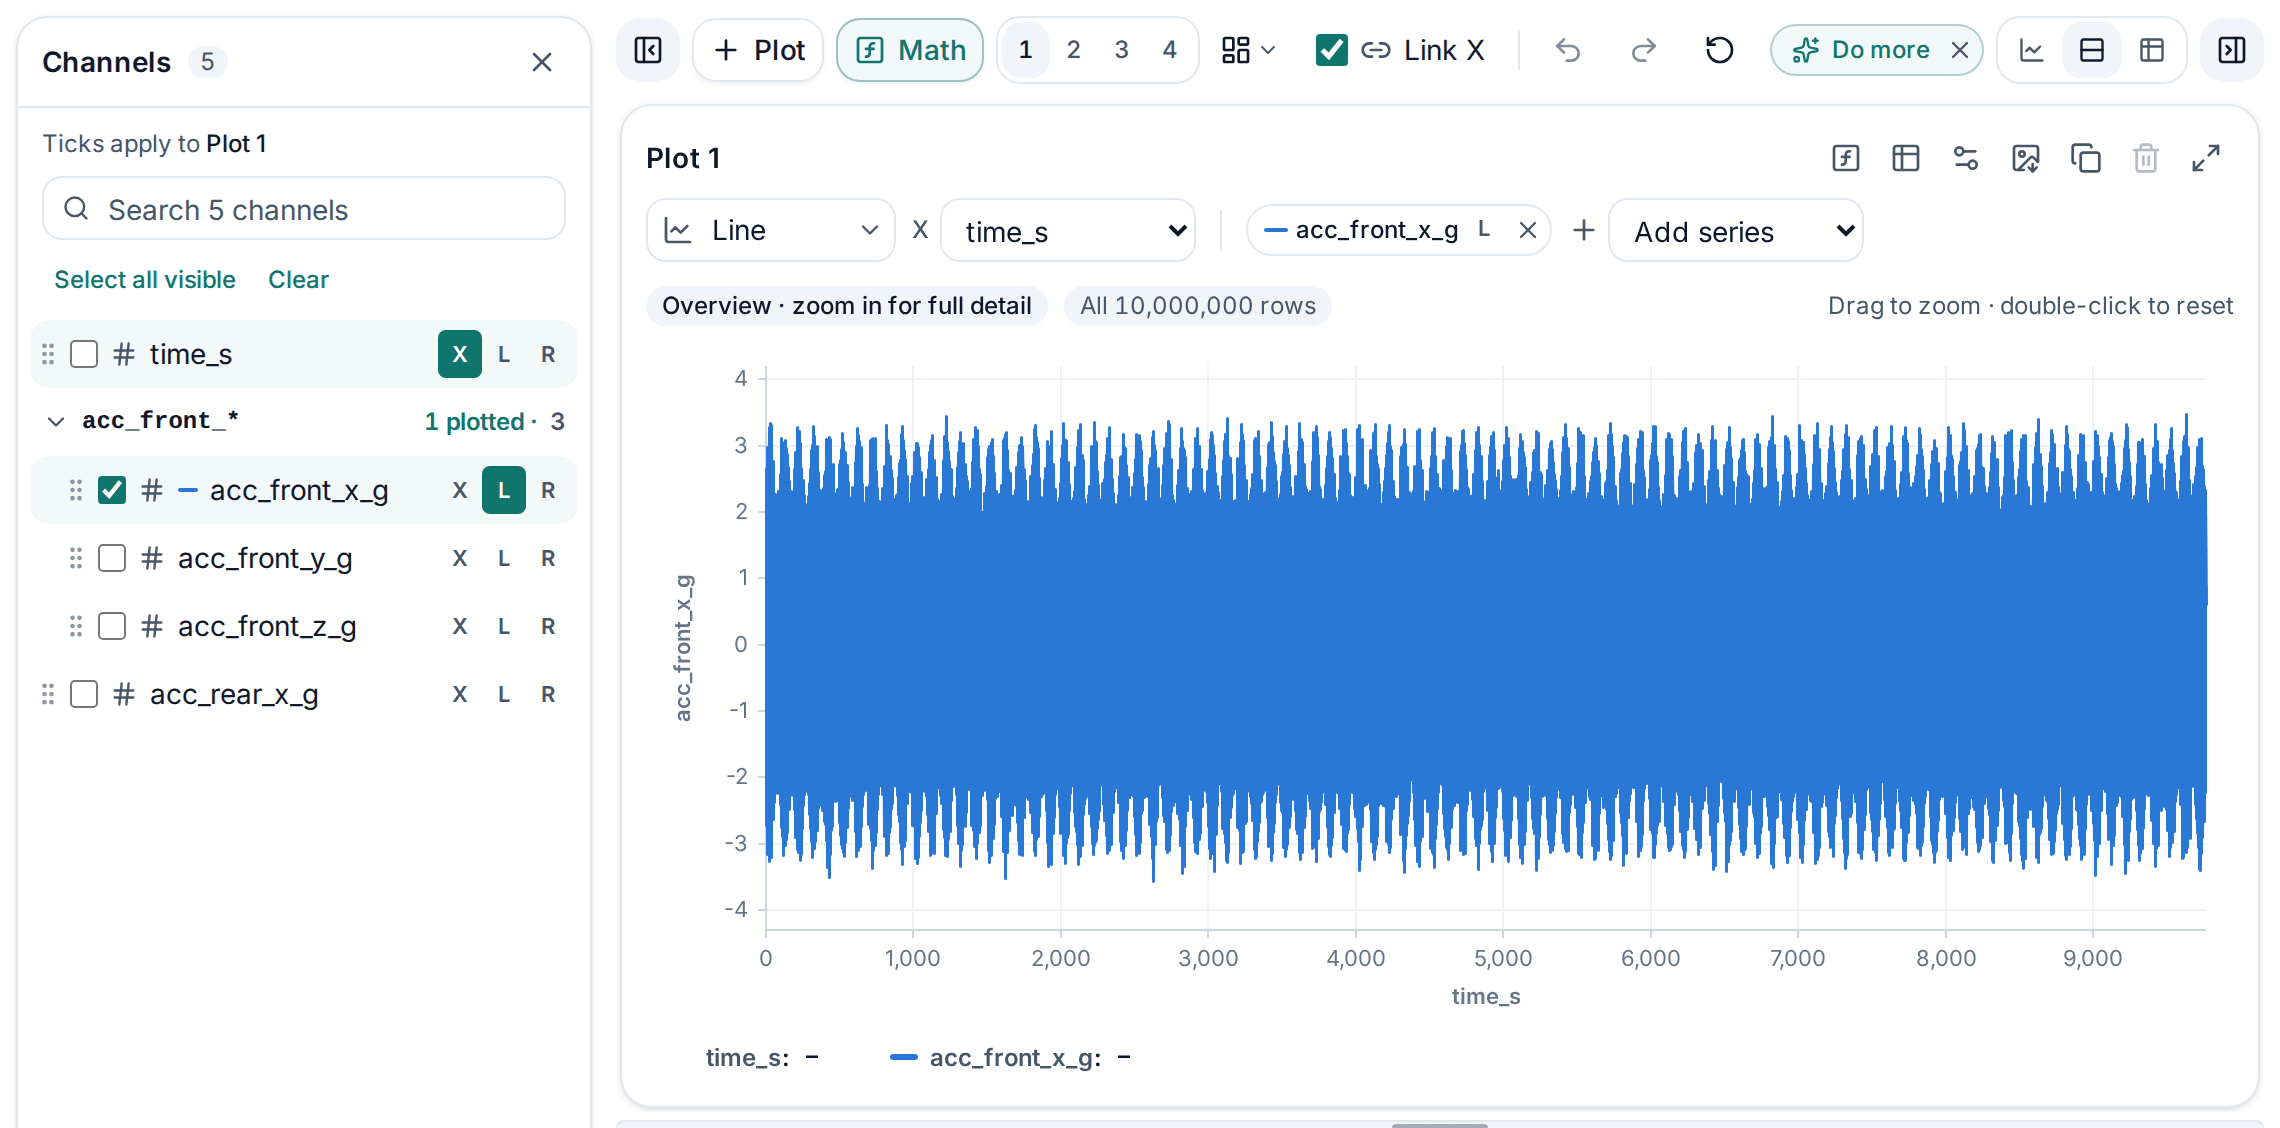
A sorted time, date or number column becomes the X axis and a first chart is drawn straight away. Pick another X from the list if you like, tick the channels you want (up to 50 per chart) and click R to give one its own right-hand axis.
Zoom, link charts and read the stats
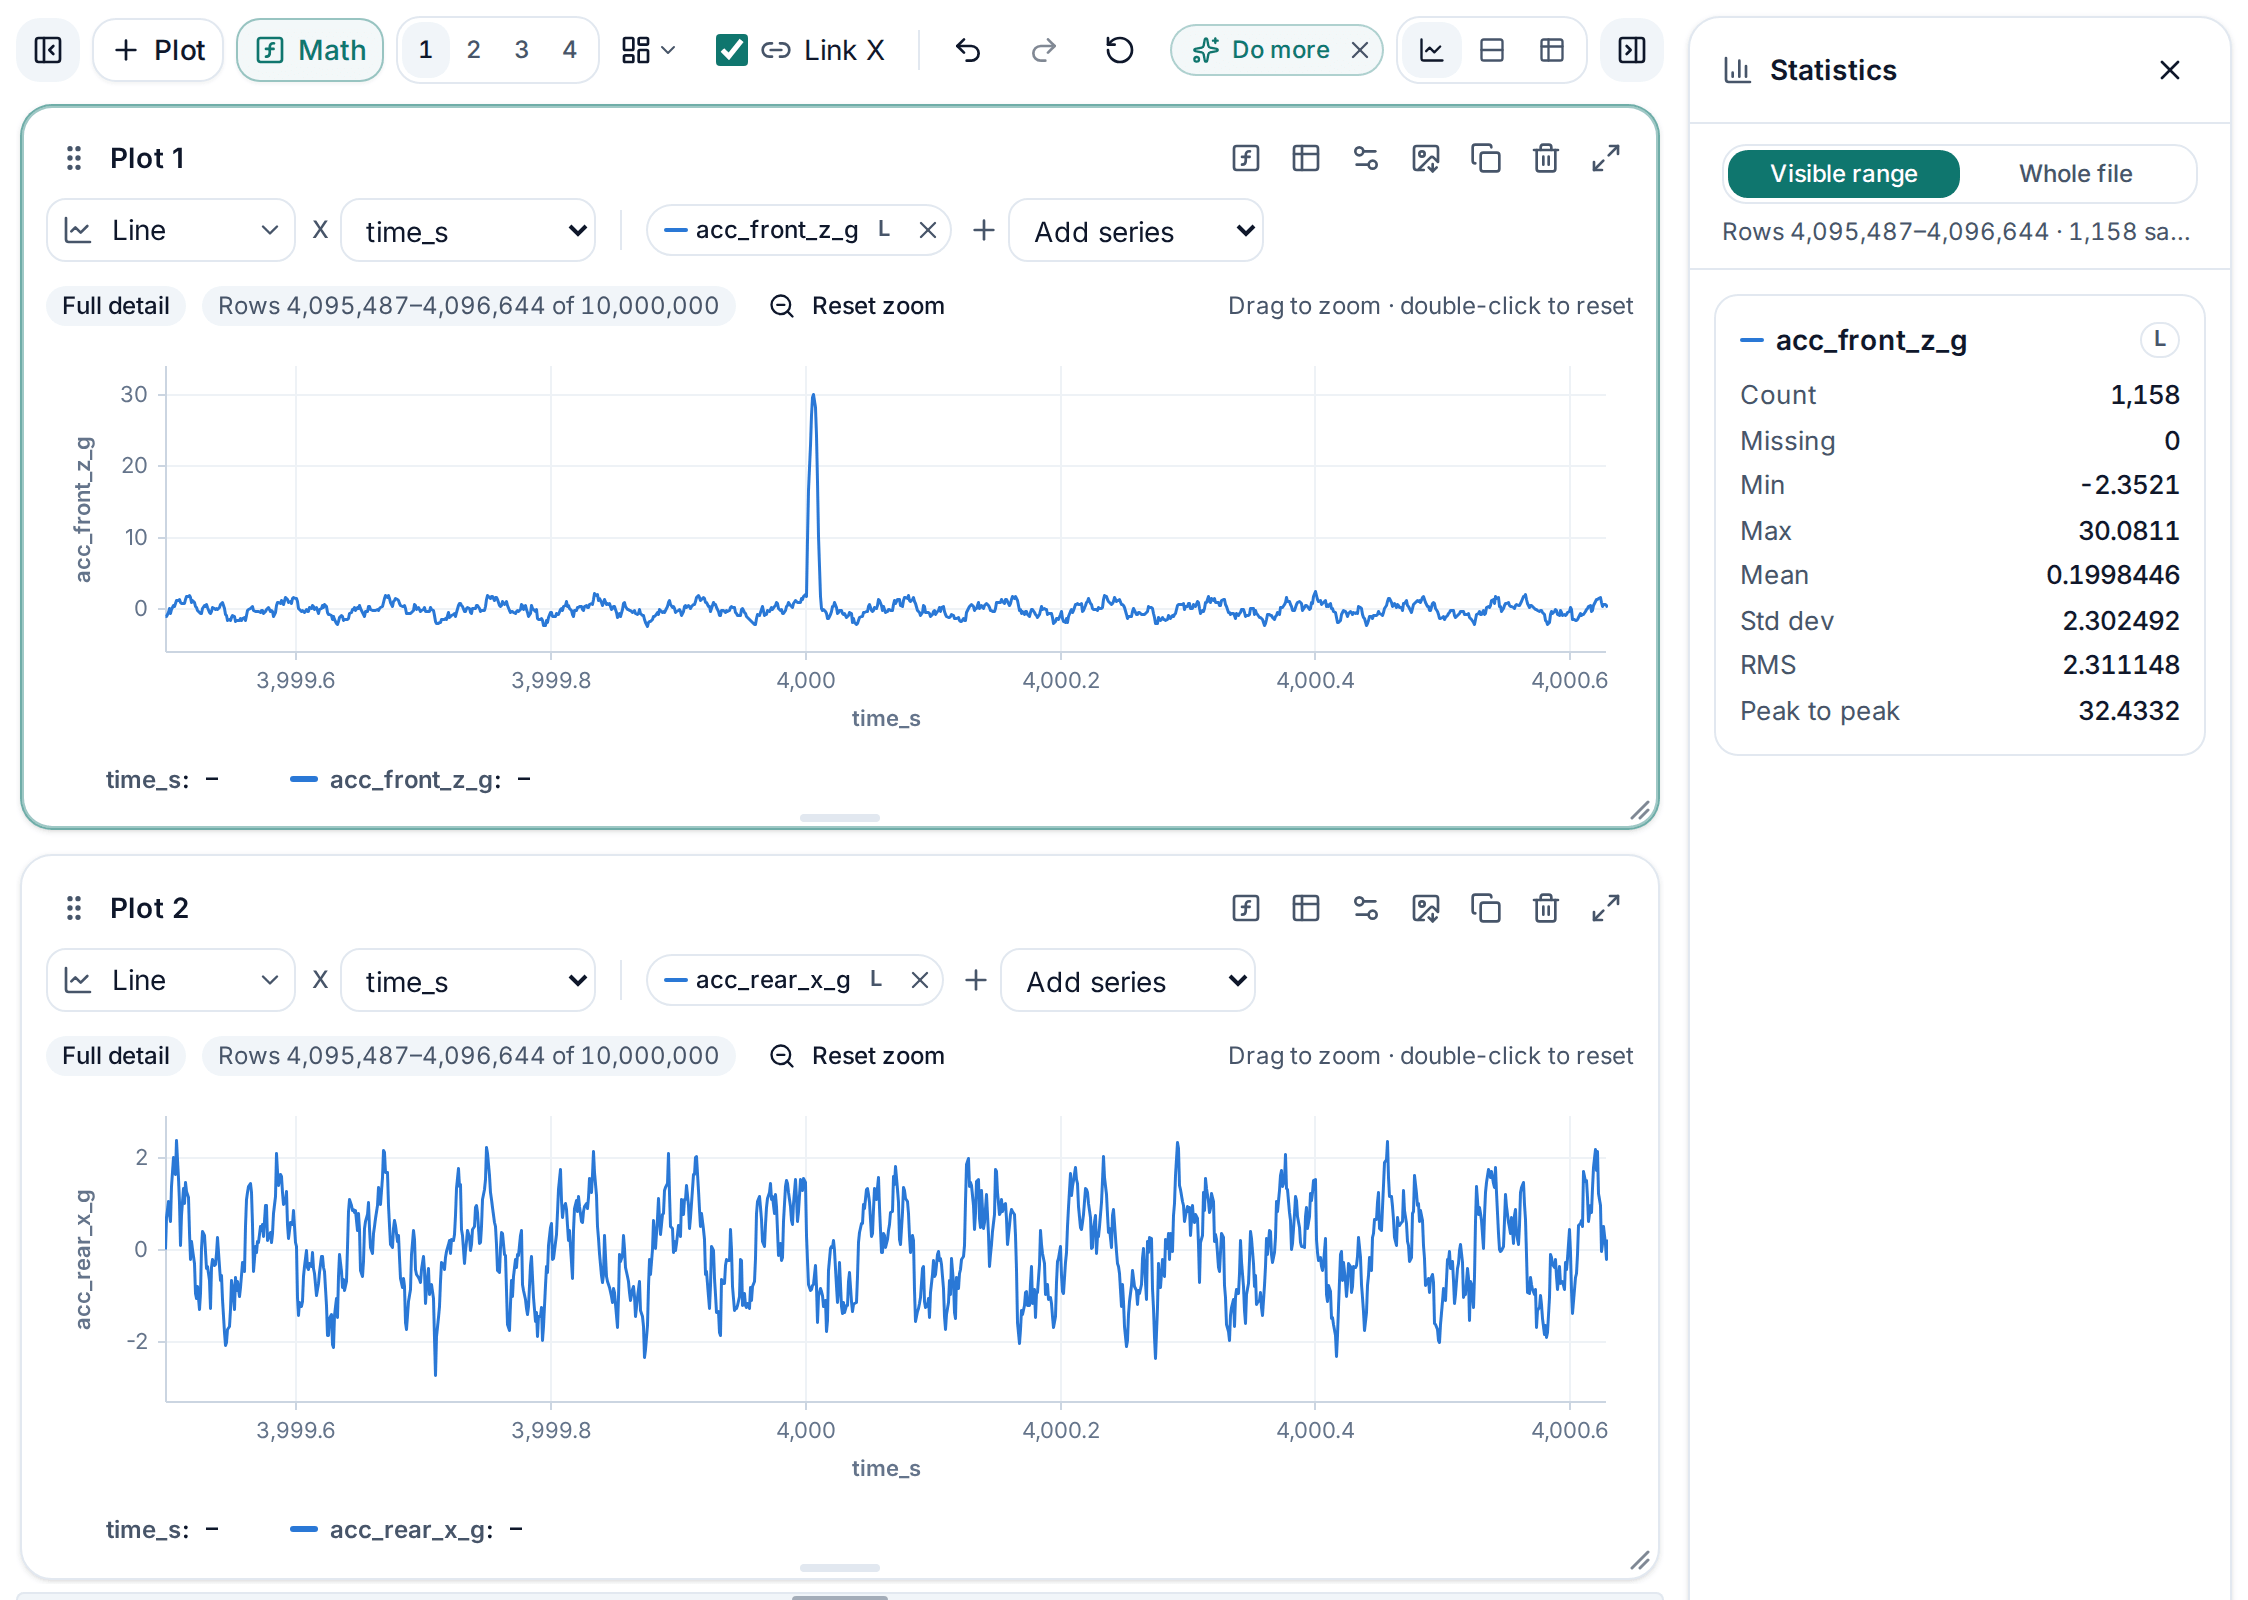
Scroll, pinch or drag across a chart to zoom in (Shift+scroll for the Y axis): the full detail of that range reloads at once, and a double-click zooms back out. Add more plots and they zoom together. The statistics panel shows the min, max, mean, RMS and more for exactly what is on screen. Need more? Switch to Bar, summarise by month or category, or open Math for filters and spectra.
Why big CSV files are hard to plot
- Spreadsheet row limits. An Excel worksheet holds 1,048,576 rows, and a Google Sheets spreadsheet 20 million cells (Google’s help page, checked 10 October 2026). A chart can only use rows that made it onto the sheet, so the rest of the file never appears.
- Drawing cost. Every point becomes a line segment that has to be drawn again on every zoom, pan and resize. SVG-based chart libraries put every point into the page as path data or as separate elements; canvas is faster, but tens of millions of segments per redraw still take seconds. In our tests, gnuplot needed 30 to 60 seconds to draw 5 million points into a PNG.
- Memory. A CSV is text. Parsed into one object per row, as many tools do, it can take several times the file size in memory, and a browser tab runs out long before your computer does.
- Pixels. Five million rows on a chart 1,500 pixels wide means more than 3,000 points per pixel column. Most of them are painted on top of each other.
Why spikes vanish when data is thinned out
Since the screen can’t show every point anyway, many tools and scripts quietly draw fewer of them. How they choose matters. The obvious shortcut, keeping every Nth row, is blind: a spike shorter than N rows disappears unless it happens to land on a kept row, noise looks calmer than it is, and regular signals can turn into slow waves that aren’t there. Averaging each block of rows has the same problem, because it flattens peaks.
In our test with 5 million rows and a spike just three rows long, plotting every 2,500th row produced a clean wave with no spike at all. The same file reduced to each block’s lowest and highest value showed the spike at full height. Before you trust a tool with big files, try it on data with a known short spike and check that it still shows when you are fully zoomed out.
Option 1: The MegaRows plotter
The MegaRows CSV plotter opens CSV, TSV, TXT, Excel (.xlsx), JSON, MATLAB .mat, Parquet, HDF5 and LabVIEW TDMS files with millions of rows in your browser and draws them as zoomable line, step, bar, area and scatter charts or histograms. A 10-million-row file opens and draws its first chart in about 3 seconds. Short peaks stay visible however far you zoom out, and when you zoom in, the full detail for that range reloads instantly. Charts can also summarise rows by month or by category, the Math button adds filters, spectra and formulas, and several files can be plotted together to compare runs. The file never leaves your device.
Measured in Chrome on a recent laptop (Apple M4): a 423 MB CSV with 10,000,000 rows and 5 columns, from choosing the file to the first chart. Slower devices take longer.
A LabVIEW TDMS recording is another input format, not a CSV, and it needs no converting first. Open the .tdms file in the TDMS viewer to inspect its groups, channel units and waveform timing before comparing traces; its channels then plot and zoom the same way.
Need the frequency content of a signal rather than its shape? FFT from CSV takes a column straight to its FFT spectrum or PSD, with results checked against SciPy.
When one spectrum is not enough. An FFT spectrum or a PSD describes the whole recording at once, so a frequency that changes during it, such as a sweep or a machine speeding up, is smeared across the spectrum. Instead, track changing frequencies with a spectrogram: the spectra of short slices of the signal side by side, time across and frequency up, from the same CSV.
To try it, follow the three steps at the top of this guide: open the file, pick the columns, zoom. No big file to hand? Download the 100,000-row sample CSV of made-up UK weather (4.69 MB).
The statistics panel shows the count, missing values, minimum, maximum, mean and standard deviation of a column, calculated from every row.
Pros: nothing to install; private; millions of rows; spikes stay visible; zoom reloads full detail; two y-axes and PNG export.
Cons: old .xls workbooks must be saved as .xlsx first; limited by your device’s memory.
Option 2: Excel
Excel is fine for charts of a few thousand points and great for polishing a final chart. For big files it runs into two walls. The data must sit on a worksheet, which stops at 1,048,576 rows. And although Microsoft lists the points per chart series as limited only by available memory (with up to 255 series per chart), charts with hundreds of thousands of points get slow to draw, resize and edit. Excel also draws every point, so a dense series turns into a solid block.
The workaround is to chart a summary. A PivotChart built from the Data Model can show one value per minute or hour; include the minimum and maximum alongside the average, or spikes vanish. Or reduce the file first with DuckDB or Python, as shown below, and chart the result.
Pros: familiar; flexible formatting; good for presenting reduced data.
Cons: row limit; sluggish with dense charts; no built-in downsampling.
Option 3: Python with matplotlib or Plotly
matplotlib can draw a few million points, but slowly, and very long line plots sometimes fail with an “Exceeded cell block limit” error (raising the agg.path.chunksize setting helps). Reducing the data first is much faster and looks practically the same. Keeping the lowest and highest value of each of 2,000 blocks means no spike can slip through the gaps. In a few lines of NumPy:
import numpy as np
import pandas as pd
import matplotlib.pyplot as plt

df = pd.read_csv("big.csv", usecols=["time", "value"]).dropna()
x = df["time"].to_numpy()
y = df["value"].to_numpy()


def min_max_downsample(x, y, buckets=2000):
    """Keep the lowest and highest point of each bucket, in order."""
    if len(y) <= 2 * buckets:
        return x, y
    edges = np.linspace(0, len(y), buckets + 1).astype(int)
    keep = []
    for start, end in zip(edges[:-1], edges[1:]):
        lo = start + np.argmin(y[start:end])
        hi = start + np.argmax(y[start:end])
        keep.extend(sorted({lo, hi}))
    return x[keep], y[keep]


xs, ys = min_max_downsample(x, y)
plt.figure(figsize=(12, 4))
plt.plot(xs, ys, linewidth=0.8)
plt.xlabel("time")
plt.ylabel("value")
plt.savefig("plot.png", dpi=150)
On our 5-million-row test file this kept 4,000 points, including the three-row spike, and the whole script ran in under two seconds. Drop rows with missing values first, as above: argmin and argmax return the position of the first NaN instead of the real extreme.
Plotly gives interactive charts in a browser or notebook. Its WebGL traces (go.Scattergl) handle far more points than the default SVG ones, and the open-source plotly-resampler package downsamples again as you zoom. Saved as HTML, a chart contains every point it draws, so reduce the data before sharing it.
Pros: free; full control; easy to repeat for many files.
Cons: needs Python and code; static matplotlib images don’t reload detail when you zoom.
Option 4: gnuplot
gnuplot is a free command-line plotting program that reads CSV files directly:
set datafile separator ","
set key autotitle columnhead
set terminal pngcairo size 1600,500
set output "plot.png"
plot "big.csv" using 1:3 with lines
It draws every point it reads, so the result is accurate, but slow for big files: our 5-million-row file took 30 to 60 seconds. Its every option (plot "big.csv" every 100 using 1:3 with lines) is fast because it is the every-Nth-point method, with the same blind spots. The interactive windows let you zoom with the mouse, but each redraw goes through all the points again.
Pros: free; scriptable; publication-quality output; reads big files.
Cons: its own syntax to learn; no built-in min/max downsampling; slow redraws.
Option 5: DuckDB and any charting tool
DuckDB is a free, single-file database that queries CSV files directly. Let it shrink the data, then chart the small result in anything, even Excel:
COPY (
  SELECT date_trunc('minute', ts) AS minute,
         min(value) AS low,
         max(value) AS high,
         avg(value) AS mean
  FROM 'big.csv'
  GROUP BY minute
  ORDER BY minute
) TO 'per_minute.csv' (HEADER, DELIMITER ',');
On our 5-million-row test file the query took well under a second and returned 834 rows with each minute’s low, high and mean. Plot low and high as two lines and the spike is still there. Use time_bucket for other intervals, or floor(x / 10) for a numeric x column.
Pros: very fast; copes with files larger than memory; the result fits easily in Excel.
Cons: needs SQL; fixed bucket size, so zooming in means running the query again.
Option 6: Online CSV plotters
Plenty of websites plot a CSV for free, and several say they read the file in your browser. Before you drop a big or sensitive file into one, check three things: whether it sends the file anywhere (the Network tab of your browser’s developer tools shows it), what size or row limit it states, and whether a short spike still shows with the whole file on screen.
Pros: nothing to install; quick for small files.
Cons: size limits and privacy differ from site to site; short spikes can vanish from the overview.
Four online CSV plotters in their own words
As of 23 Oct 2026, this is what four online CSV plotters say about themselves on their own pages, linked in every cell. We read those pages; we did not try the tools with files. “Not stated” means we could not find it on the linked page, not that the tool can’t do it. The MegaRows row is what our own tests check.
| Plotter | Where the file is processed | Size limit | Chart types | Export | Price |
|---|---|---|---|---|---|
| MegaRows plotterThis site, from our own tests | Runs in your browser. Files are never uploaded. | No fixed limit: your device’s memory sets it. Tested with a 1.4 GB CSV of 28 million rows. | Line, step, bar, area and scatter charts, histograms and box plots | Any chart as a PNG image, and the rows you are looking at as a CSV file. | Free. No account or sign-up. |
| CSV Plot | “Private, your data never leaves your device”csvplot.com, | Not statedcsvplot.com, | Not statedcsvplot.com, | Not statedcsvplot.com, | Not statedcsvplot.com, |
| iPlotCSV | “Files are parsed locally in your browser. Your data stays yours.”iplotcsv.com, | “Max 5MB · Premium 100MB”iplotcsv.com, | “line, scatter, bar, and area charts”iplotcsv.com, | “Publish interactive dashboards with secure share links.”Premium planiplotcsv.com, | “No signup required to try. Free accounts unlock saving.”“$5/month · Cancel anytime”iplotcsv.com, |
| Kanaries CSV to Chart | “In your browser. The CSV is not uploaded”kanaries.net, | “No file size cap, including GB-scale CSV files”“… depends on your device’s available memory”kanaries.net, | “14 types in total, including box plot, heatmap, pie, and maps”kanaries.net, | “PNG, SVG, chart data as CSV, embed link”kanaries.net, | “Free, no account”kanaries.net, |
| WebUtility.io CSV to Chart | “No login, no uploads to any server. Everything runs locally in your browser”webutility.io, | Not statedwebutility.io, | “Bar, line, pie, doughnut, radar, polar area, and horizontal bar”webutility.io, | “Download your finished chart as a transparent-background PNG”webutility.io, | “100% Free & Private”webutility.io, |
Not in this table: spreadsheets and the tools where you write code, which are Options 2 to 5 above. Pages change, so check the linked page before you rely on a cell.
Which option should you choose?
| Option | Millions of rows | Spikes kept | Zoom to full detail | Install |
|---|---|---|---|---|
| MegaRows plotter | Yes | Yes | Yes | None |
| Excel | No | Yes, if it fits | Manual | Excel |
| matplotlib with min/max | Yes | Yes | Re-run | Python |
| gnuplot | Slowly | Yes | Slow redraws | gnuplot |
| DuckDB summary | Yes | With min and max | Re-run | DuckDB |
| Other online plotters | Depends on the site | Varies | Varies | None |
To explore a file and find the interesting part, use a tool that zooms to full detail. For a report, reduce the data with min and max per bucket and chart the result wherever you like.
Frequently asked questions
How do I plot a CSV file with millions of rows?
Use a tool that reduces the data to what the screen can show without dropping extremes, and reloads detail when you zoom. The MegaRows plotter does this in your browser. In Python, keep the minimum and maximum of each bucket before plotting, or let DuckDB summarise the file and chart the result. An Excel worksheet holds up to 1,048,576 rows.
Why can’t Excel chart my whole CSV file?
A chart can only use rows that are on a worksheet, and a worksheet holds 1,048,576 rows, so anything beyond that is never loaded. Microsoft lists the number of points per chart series as limited by available memory, but charts with hundreds of thousands of points become slow to draw and edit long before that.
Why do spikes disappear when I plot a big file?
Usually because the data was thinned out. Plotting every Nth row, which many tools and scripts do to stay fast, skips anything shorter than N rows unless it lands on a kept row, and averaging blocks of rows flattens peaks. In our test, every 2,500th row of a 5-million-row file showed no trace of a three-row spike. Keep each block’s minimum and maximum instead, or use a tool that keeps peaks visible.
Does thinning out the points change my data?
No. It only affects what is drawn; the file itself is not changed. A chart drawn from thinned data can still mislead you, so check the extremes separately. In the MegaRows plotter, the statistics panel shows each column’s minimum, maximum and mean calculated from every row.
Can I plot a CSV file online without uploading it?
Yes, with a tool that processes the file in your browser. The MegaRows plotter reads the file on your device and sends nothing to a server; you can confirm this in the Network tab of your browser’s developer tools, and the same check works for any online plotter.
How big a file can the MegaRows plotter open?
There is no fixed limit on rows or file size: the practical limit is your device’s memory. A 10-million-row CSV opens and draws its first chart in about 3 seconds (measured in Chrome on a recent laptop, with a 423 MB CSV of 10,000,000 rows and 5 columns), and zooming in and out stays smooth.
Can I plot Excel, JSON or MATLAB files?
Yes. Besides CSV, TSV and TXT, the MegaRows plotter opens Excel .xlsx and .xlsm workbooks, JSON and JSON Lines files, MATLAB .mat files, and Parquet, HDF5 and LabVIEW TDMS files. Old .xls workbooks are not supported: open them in Excel and save them as .xlsx first.
Can I plot two columns with different units on one chart?
Yes. The MegaRows plotter has a left and a right y-axis: put a temperature on one and a pressure on the other, for example. In Excel use a secondary axis, and in matplotlib use ax.twinx().
Related tools and guides
- CSV plotterPlot CSV, Excel, MATLAB, Parquet and TDMS files
- Large CSV viewerScroll every row of a CSV too big for Excel
- Plot multiple CSV files on one graphSeparate runs on one chart, labelled by file
- Split CSV filesCut a big CSV into files Excel can open
- How we measure speedThe test files, laptop, browser and repeats
- FFT and PSD from a CSVFFT and PSD with Grms from a signal column